Analysis - Multiplotting Questions
Unlike crosstabulation, multiple plotting of questions creates a display of questions with the plots arranged in vertical order. This display allows the analyst to show a comparison of several questions' responses.
To Multiplot Questions:
- Select Analysis
 Multiplot or use the keyboard combination Ctrl+Shift+N.
The Multiplot dialog box will appear.
Multiplot or use the keyboard combination Ctrl+Shift+N.
The Multiplot dialog box will appear.
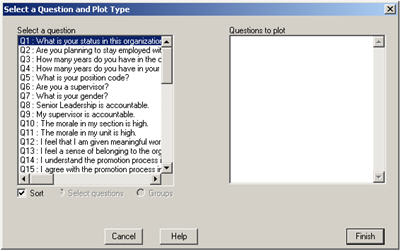
- In the listbox labeled Select a question, select the questions to be included in the plot. Click on the question to move it into the Questions to plot window.
- You can deselect the question to plot by clicking on it.
- Click Finish. The mouse pointer will now be a cross-hair.
- Locate the cross-hair where you would like the plot to appear and press the left-mouse button.
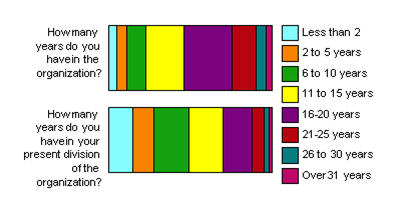
- The plot and its legend can be adjusted separately.