 Plot) they are displayed according to the options chosen here. Use Edit
  Colors
to change colors on individual graphs.
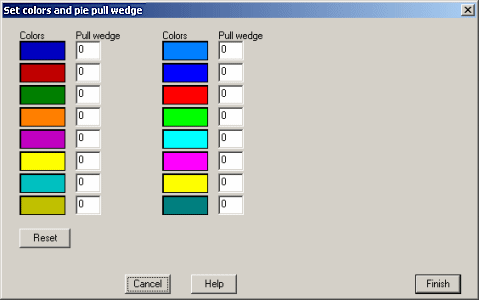
Sets the default graph colors so that when new graphs are generated (using Analysis  Plot) they are displayed according to the options chosen here. Use Edit
  Colors
to change colors on individual graphs.

Each drop-down color box represents a bar in a bar plot. The colors are assorted
in order so that the first color in the list is associated with the first bar.
For pie plots only, this box can also be used to offset or pull the pie wedges
for better visualization. The value in the Pull wedge box next to its associated color
is a pixel value. This will offset the wedge by the specified pixel value.