EZReport calculations
Single-choice
When EZReport scans the database, it computes the number of records (as selected by a query) which belong to each category. For single-choice question, categories are designated by short codes, and matching records have a single short code in the appropriate field. A record is counted as a miscode if it is ambiguous or does not match any of the available response codes.
|
Response code |
Data value |
Match? |
|
A |
A |
Yes |
|
|
|
Yes |
|
A |
a |
No |
|
A |
A,b |
No |
Combo box
Combo box questions are similar to single choices, except that code values are not sensitive to case, since they may be typed in by the respondent as well as selected from a list
|
Response code |
Data value |
Match? |
|
A |
A |
Yes |
|
A |
a |
Yes |
Summary statistics
Only data values that evaluate to a well-formed number are used in calculating summary statistics. Leading and trailing whitespace are ignored.
|
Data value |
Number value |
|
5 |
5.0 |
|
Error |
|
|
-0.0 |
0.0 |
|
ten |
Error |
|
-8.5e4 |
-85000.0 |
|
5,8 |
Error |
|
4 inches |
Error |
The Average, Standard Deviation, and Standard Error calculations neglect
records whose data values do not properly evaluate to numbers. All calculations
are performed with 64-bit floating-point numbers. Rounding is done by the CPU.
Plots
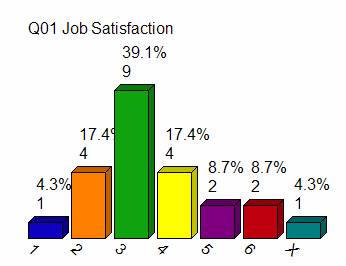
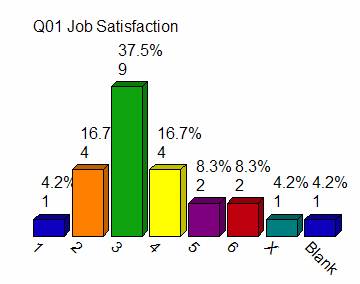
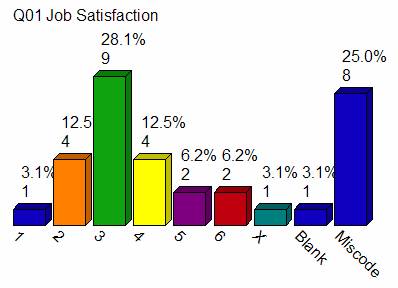
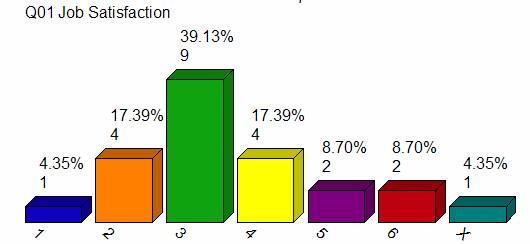
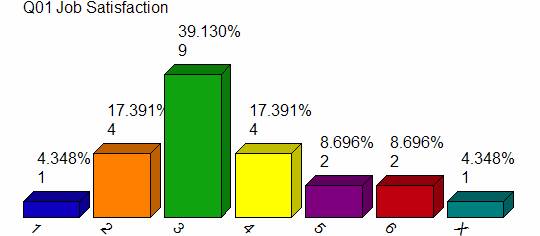
Bar and pie plots are scaled according to the number of responses matching each category. Percentages are then calculated based on the number of records represented in the plot. Here are four plots of the same data set. The numbers of responses are the same, but the percentages differ, depending on which columns are shown.
|
Standard set of responses |
|
|
with X (Don't know) |
|
|
with Blank (unanswered) records |
|
|
with Miscodes (unrecognized responses) |
|
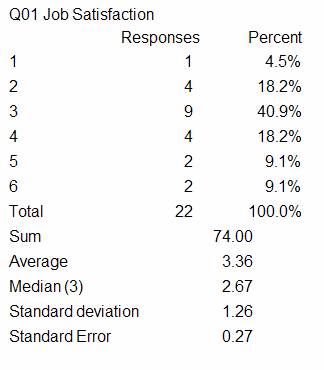
Statistics
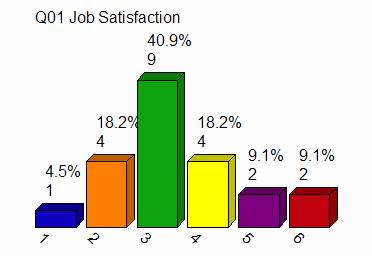
In accordance with social science conventions, the median is presented as a decimal value. For the above data, the responses can be sorted like this, where the median falls in the middle. Since the center of the table (black line) falls 2/3 of the way to the top of the "3" block, the median is declared to be 2.67.
|
1 |
2 |
2 |
2 |
2 |
3 |
3 |
3 |
3 |
3 |
3 |
3 |
3 |
3 |
4 |
4 |
4 |
4 |
5 |
5 |
6 |
6 |
If all the responses were "6" in this example, the median should be 6, indicating a high score. If all the responses were "1", the median would have to be 1. If there were two responses, "1" and "2", the median would be 1.5.
Non-numeric codes like X, blanks, and miscodes are disregarded for the median, average, and standard deviation calculations. The Standard Error line means "Standard error of the mean," simply (Standard deviation/ (sqrt(Total))).
Percentages
Since this is a single-choice question, the sum of the percentages should add up to 100%. However, rounding can cause a slight deviation from 100%.
|
One decimal. Total = 99.8% |
|
|
Two decimals. Total = 100.01% |
|
|
Three decimals. Total =
100.000% |
|

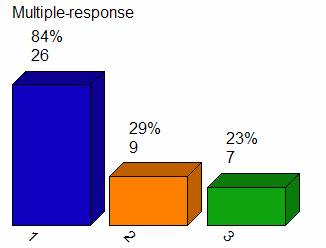
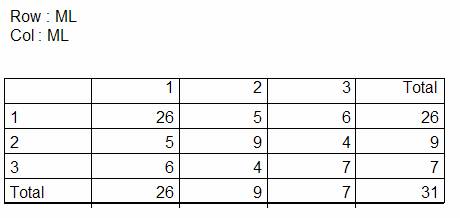
Multiple-response questions are often confusing. The percentages in these plots
mean "The fraction of respondents who answered X." Since each person
can make more than one answer, the sum of the percentages will usually exceed
100%. A crosstab table of the question shows why that occurs with this
interpretation of percentage. The other interpretation of percentage would be
"The fraction of all responses represented by this block," which is
not usually what analysts want when they make reports.
|
Bar plot |
|
|
Crosstab table |
|