Consider the following example:
/*! Invisible class because of truncation */
class Invisible { };

/*! Truncated class, inheritance relation is hidden */
class Truncated : public Invisible { };

/* Class not documented with doxygen comments */
class Undocumented { };

/*! Class that is inherited using public inheritance */
class PublicBase : public Truncated { };

/*! A template class */
template<class T> class Templ { };

/*! Class that is inherited using protected inheritance */
class ProtectedBase { };

/*! Class that is inherited using private inheritance */
class PrivateBase { };

/*! Class that is used by the Inherited class */
class Used { };

/*! Super class that inherits a number of other classes */
class Inherited : public PublicBase,
                  protected ProtectedBase,
                  private PrivateBase,
                  public Undocumented
                  public Templ<int>
{
  private:
    Used *m_usedClass;
};
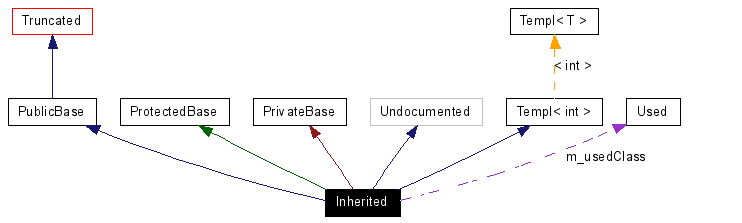
MAX_DOT_GRAPH_HEIGHT tag in the configuration file is set to 240 this will result in the following graph:
The boxes in the above graph have the following meaning: